
Organization Design
Model structural changes to your organization and see the impact on your costs and overall health.
Access requirements
Permission with these capabilities: Organization Design
Reach out to your administrator for access.
Overview
Organization Design is a dynamic canvas where you can model and analyze structural changes to your organization. The changes you model are based on your real data points, which integrates your current hierarchies and positions so you can see the immediate structural and financial impacts of design changes. With key metric summaries built directly into your workflow, you can gain insights quickly and ensure every structural decision aligns with your broader strategic goals.
Some common use cases include:
- Restructuring for growth: Create new organizations and reallocate talent to fill new positions.
- Leadership changes: Optimize changes in leadership by modeling strategic structural changes that improve management efficiency, streamline reporting lines, and eliminate organizational bottlenecks.
- Planning workforce reductions: Identify redundant positions and move them into a holding area to calculate the cost savings.
- Improving organization efficiency: Identify opportunities to improve spans and layers within the organization.
Beyond data visibility, you gain perspective on your organization's structural integrity and health as you work. Integrated design principles automatically flag structural issues—such as pay level misalignment or managers with too many or too few direct reports—while real-time metrics show how your changes affect your budgeted total costs.
Organization Design works with Visier's security model to ensure you only see data you are permitted to see. Your data security context is applied when you are working with organizational structures. Position data is persisted within a design, so you will always see the positions you modeled even if your access level changes later. In contrast, employee data will update to be shown or hidden based on your current permissions. For a list of data requirements, see Organization Design Data Requirements.
Create an organizational structure
- On the navigation bar, click Organization Design
 > Create org structure.
 - Type a name for the org structure.
- Optional: If your administrator has set a default filter context for your organization, you can toggle the filters to refine your position scope in your org structure. Some toggles may be off by default depending on your loaded data.
- Optional: Select one or multiple starting points. By default, you are designing for the entire organization. Selecting a starting point focuses your design on a specific branch of the organization. Selecting multiple starting points lets you view specific teams side by side.
- Click Create.
Explore an organizational structure
The following screenshot shows a newly created organizational structure.
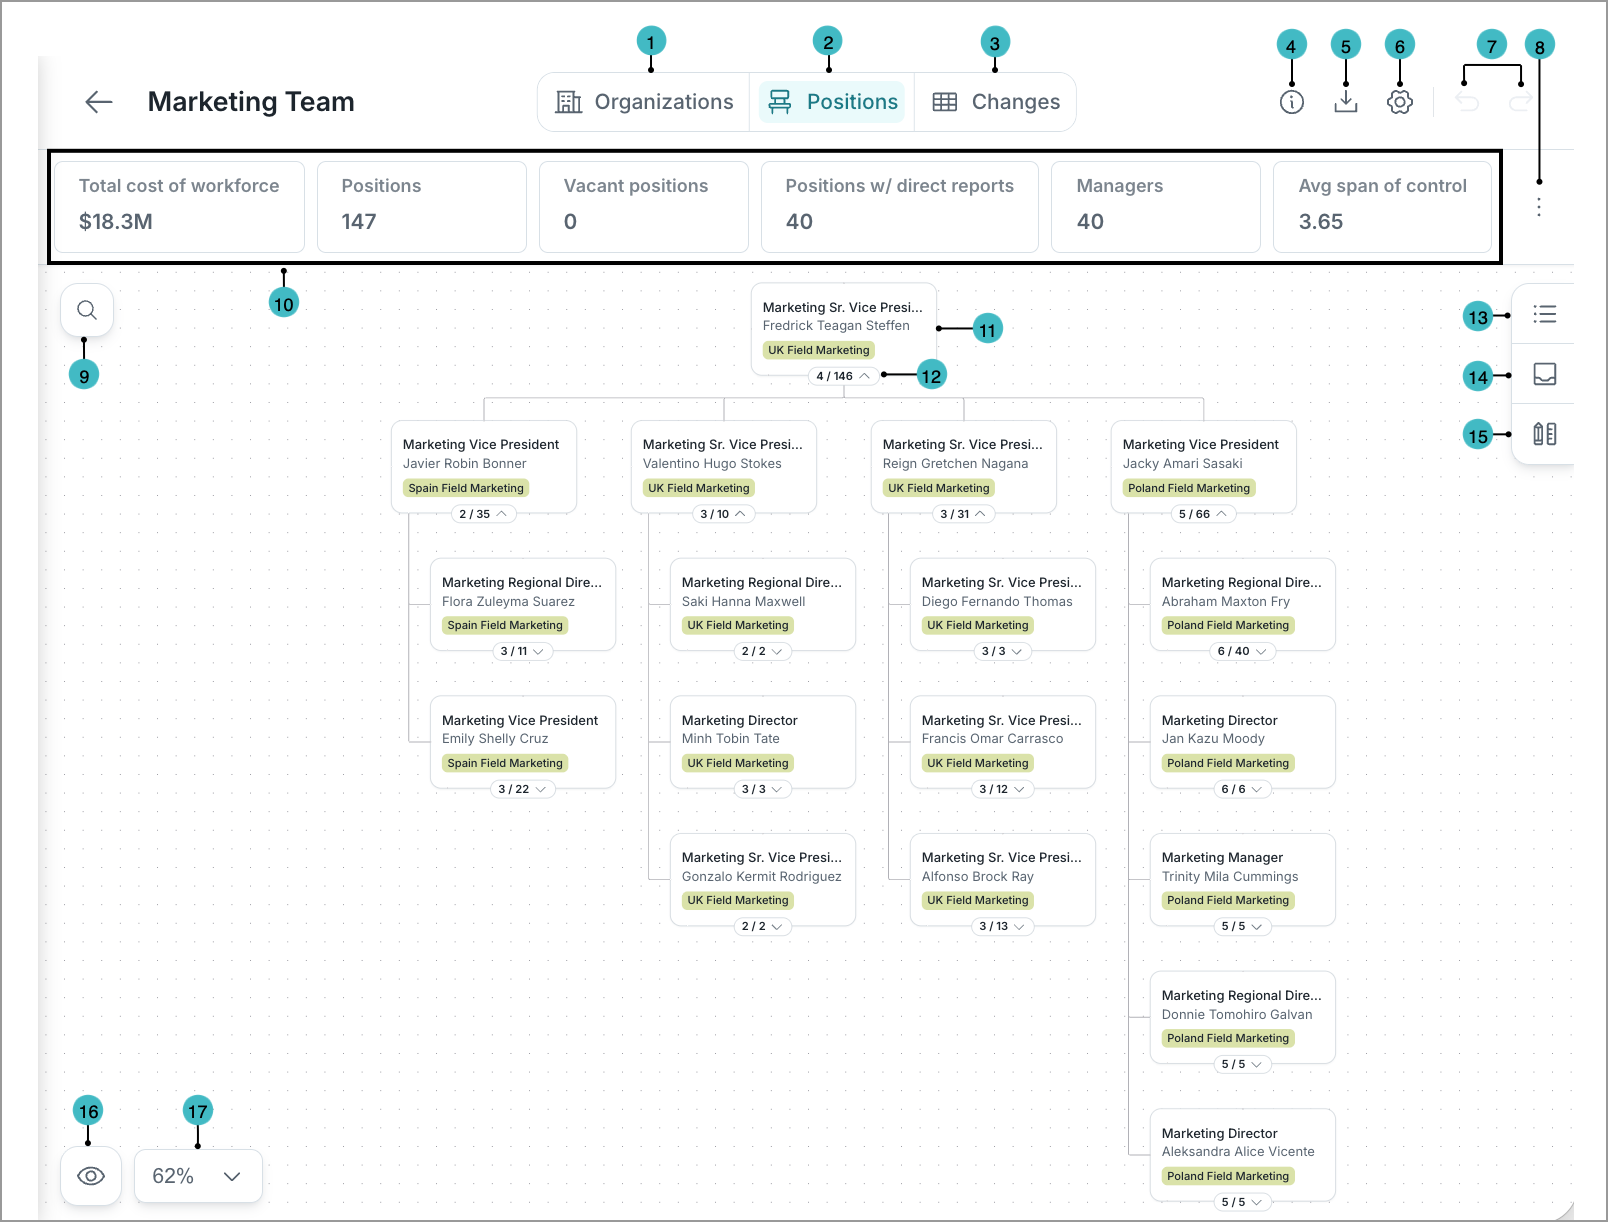
- Organizations view: A view for high-level designing. Add, move, or edit entire organizations. For more information, see Design by Organization.
- Positions view: A view for granular designing. Manage individual positions and edit specific position details. For more information, see Design by Position.
- Changes view: A final table of changes made that you can export to CSV or XLSX.
- Show org structure details: See details of the org structure such as baseline date, starting point, and currency.
- Export to PowerPoint: Export your org structure to PowerPoint.
- Settings: Customize the appearance of nodes to display the information most relevant to your goals.
- Actions: Actions you can take.
- Undo: Reverses your last change.
- Redo: Restores your last change.
- Customize metric summary: Select which key metrics, such as budgeted cost or span of control, are included in the metric summary.
- Search bar: Use this to quickly find and jump to specific employees or positions (in Positions view) or organizations (in Organizations view) within the canvas.
- Metric summary: Overall key metric values that automatically adjust as you make changes. Hover over a key metric to compare Scenario, Baseline, and Difference values, or view a detailed metric breakdown. Scenario and Baseline compare the current values based on your modeled changes against the original values from when you first created the org structure, while Difference shows the difference between the two.
- Node: Represents a position (in Positions view) or an organization (in Organizations view). Click a node to view and edit its details.
- Expand: Located on a node, click this to show nested direct reports or organizations. The numbers represent the direct reports out of total reports (in Positions view), and the number of sub-organizations (in Organizations view).
- Show details: Also accessible by clicking a node in the canvas. Use this panel to view key metrics, view and edit position or organization details, and manage assignments.
- Show holding area: A staging area for unassigned employees and positions. Use this area to track potential exits or internal moves before finalizing changes. You can drag employees and positions back into the canvas to re-add them to your org structure.
- Show design principle: A panel in Positions view where you can see organizational guardrails set by your administrator that you should adhere to when designing your org structure.
- Hide employees: A toggle in Positions view that removes employee names from the canvas. This allows for unbiased structural planning by focusing on positions rather than individuals.
- Zoom: Zoom in or out, or reset the view back to default.